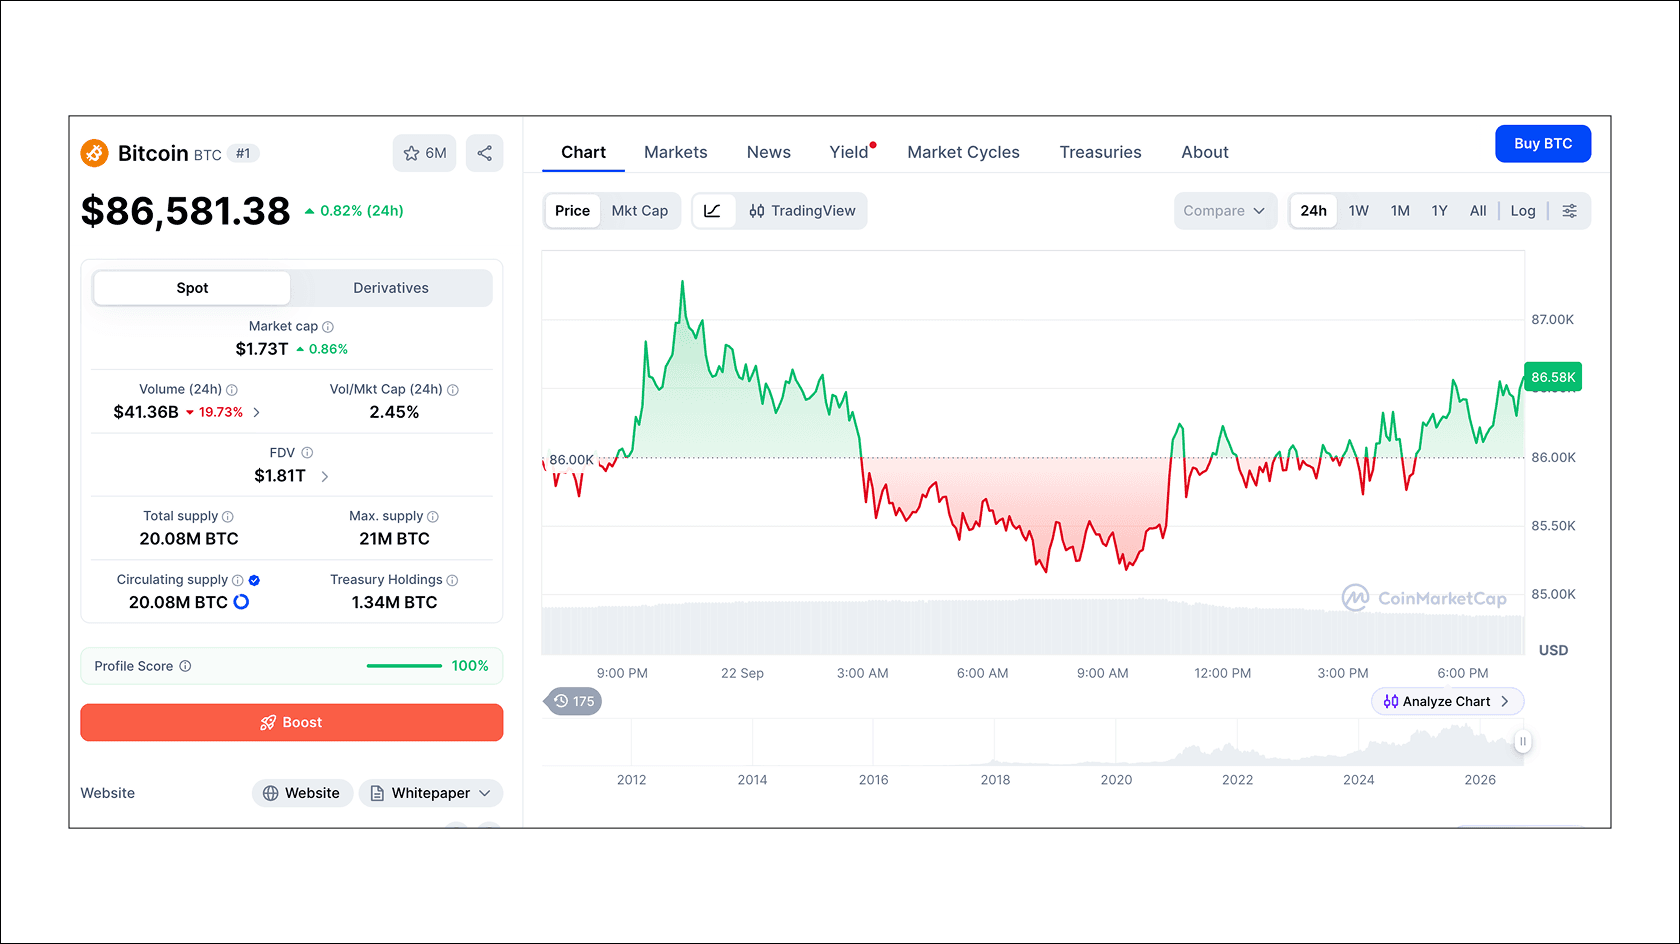
On September 21, Bitcoin rose to $87,300, posting its strongest daily gain since late January, while US spot BTC ETFs recorded nearly $1B in net inflows. According to CoinGlass morning data, even before the move toward $87,000, the market had already liquidated about $650M worth of short positions. That short squeeze accelerated the move after Bitcoin broke out of its September range.
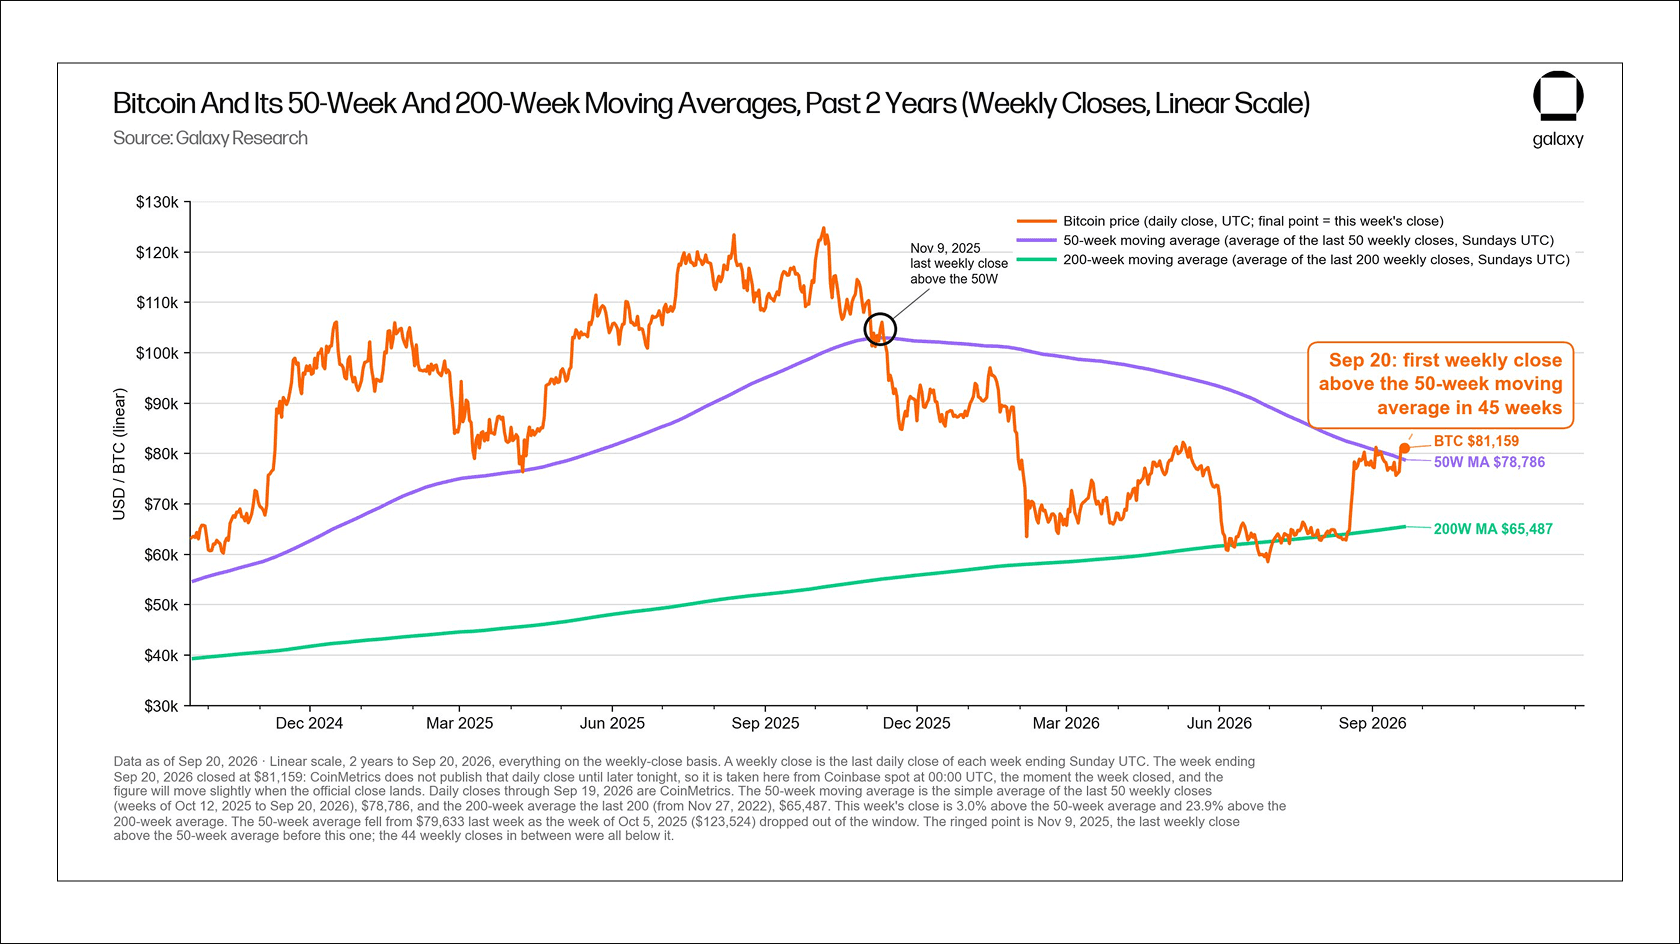
A longer-term signal is also worth noting: on September 20, Bitcoin closed at around $81,160, above its 50-week moving average for the first time in roughly 45 weeks.
At the time of publication, Bitcoin was holding above $86,000.
$1B in BTC ETF Inflows in a Single Day
According to data from Farside Investors, US spot BTC ETFs recorded $999M in net inflows on September 21. That was the largest daily inflow of 2026 and the strongest day since October 6, 2025. Over three sessions, the funds attracted around $1.6B.
The previous 2026 record was about $844M on January 14.
Despite the September 21 surge, the year-to-date balance remains negative at around $464M.
According to an estimate by James Seyffart of Bloomberg Intelligence, once Bitcoin moved above $81,700, the average buyer of US spot ETFs was back in profit for the first time since January.
Corporate demand also showed up on Monday. Strategy disclosed that it had purchased 950 BTC for $75.7M the previous week at an average price of $79,670. After the purchase, the company held 846,000 BTC at an average price of $75,416.
The Impact of Liquidations
The rally was accelerated by short liquidations. According to CoinGlass data for September 21, about $648M worth of short positions were liquidated across the market over 24 hours, while total liquidations reached roughly $750M.
Open interest, however, did not disappear. CoinDesk reported a 7.6% increase in open interest to around $156B across the crypto market: traders were opening new positions rather than leaving the futures market. Glassnode noted that the move was driven by spot and perpetual buying, while funding rates still did not look overheated.
This is where the key question around the current rally comes in. If the price was driven only by traders covering short positions, the momentum could fade quickly. If large purchases through ETFs continue, the move will have a more durable source of demand behind it.
Signals Are Getting Stronger
Alex Thorn, head of research at Galaxy, noted that Bitcoin had closed a week above its 50-week moving average for the first time in 45 weeks. In the 35 days leading up to that close, Bitcoin had risen 29%.
“A return to this line has historically served as a strong confirmation that bear-market lows are already behind us,” he wrote.
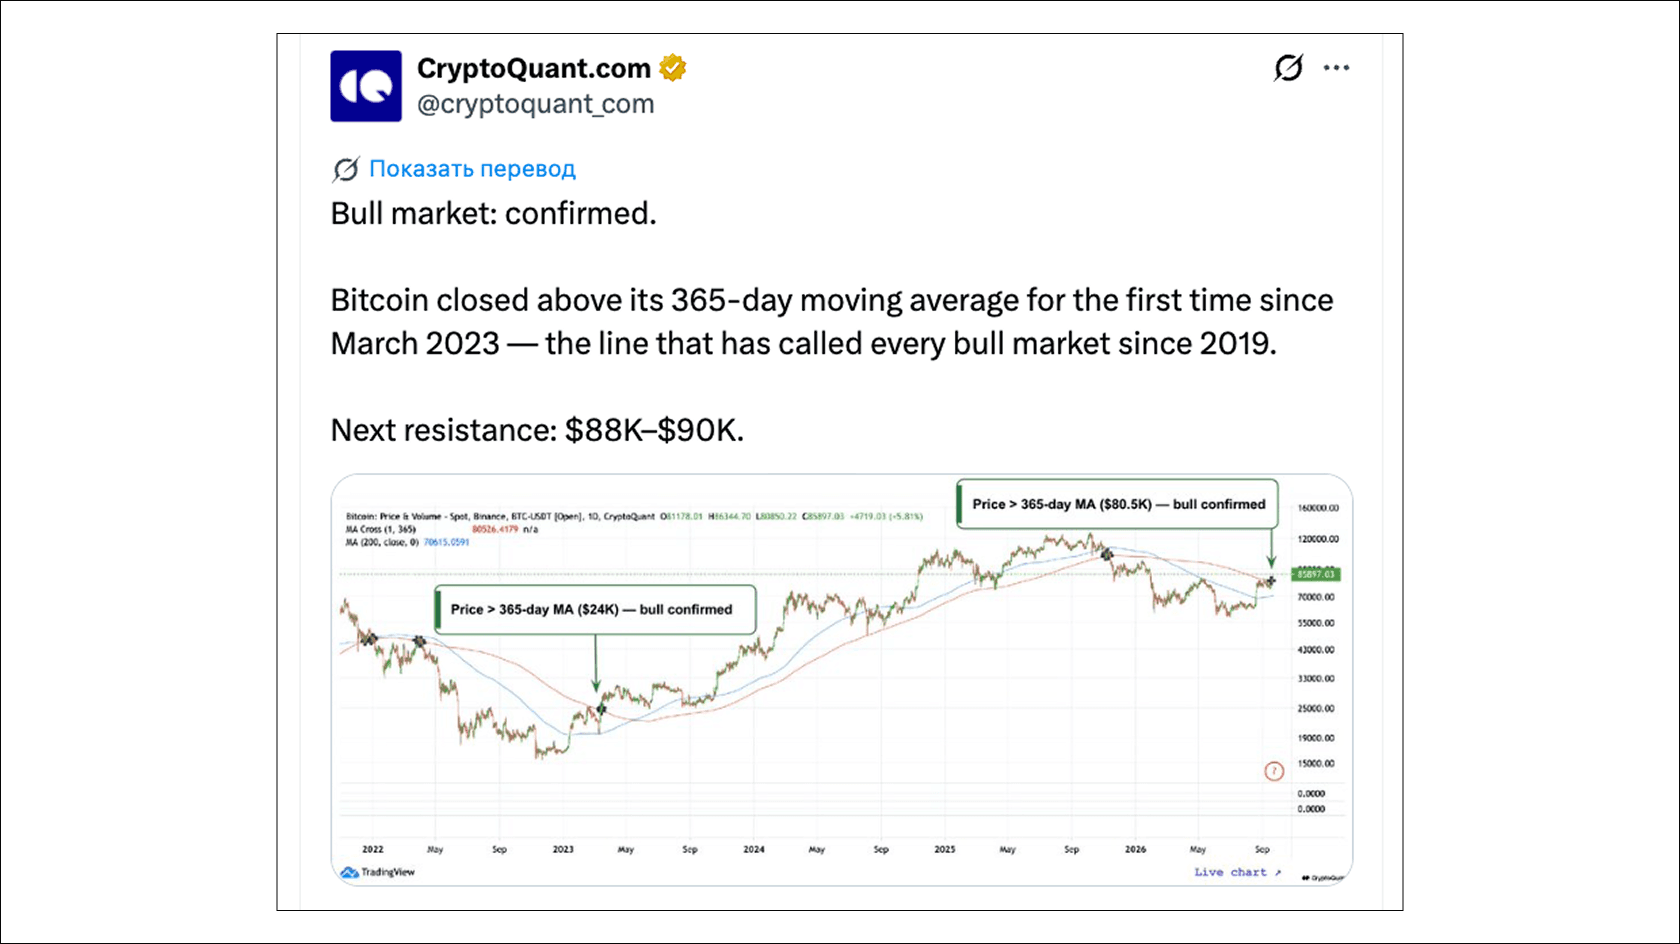
Julio Moreno, head of research at CryptoQuant, said on September 21 that a move above the 365-day moving average was the final signal needed to confirm a bull market. The following day, CryptoQuant recorded a close above that line for the first time since March 2023.
“Bull market confirmed,” the analysts wrote.
Read also: Analyst Says the Crypto Winter Is Over
According to an estimate by Nicolai Sondergaard of Nansen, the price turned bullish faster than market positioning did. The move looks more like a mix of ETF demand and a short squeeze than accumulation by large holders. The largest Bitcoin traders on Hyperliquid remained net sellers, while on-chain flows over the past two days were moving to exchanges rather than away from them.
“In the short term, the move could continue if under-positioned participants start chasing the price. But it is vulnerable if ETF inflows weaken or Treasury yields rise again,” Sondergaard said.
Sondergaard sees $87,000 and the psychological $90,000 level as the next targets, provided spot demand remains strong.
This gap matters: traditional financial products are already showing strong demand for Bitcoin, while some crypto-native participants have yet to join the move.
Macroeconomic Conditions Support the Market
Bitcoin rose alongside US stocks on September 21. The Nasdaq closed at a record 27,122 points, Brent crude fell toward around $100, and the yield on 10-year US Treasuries was around 4.95%. Lower bond yields and oil prices supported demand for riskier assets.
This week, US-Iran talks will take place, while a US-China summit is scheduled for Thursday. Traders are hoping these talks will lead to progress on the conflict in the Middle East and extend the trade truce with Beijing. Later that same day, Donald Trump is also scheduled to meet with several world leaders.
On September 16, the US Federal Reserve raised its key interest rate by 25 basis points to 3.75%-4%. The new range took effect on September 17, yet Bitcoin continued to rise even after the Fed’s hawkish decision.
What Bitcoin Needs for a Move Toward $90,000
On September 22, after pulling back, Bitcoin continued to trade above $86,000. If that level holds, yesterday’s breakout will receive confirmation on a longer time frame.
Nansen analysts see $90,000 as the next target. For the move toward that level to be more than a short squeeze, the market needs the same conditions that drove the September 21 rally: Bitcoin holding the $85,000-$86,000 zone and fresh, large inflows into spot BTC ETFs. Without renewed ETF buying, $90,000 will remain a psychological target rather than a confirmed price objective.
Leverage has not disappeared after the rally, but it does not look overheated yet. On September 21, Glassnode recorded rising spot and perpetual demand alongside a slow recovery in leverage. Funding rates remained below neutral. This combination can accelerate a move in either direction, but by itself it does not mean the market is already overloaded with positions.
Sentiment has already moved well beyond neutral. At the time of publication, the Fear & Greed Index stood at 78, up from 70 a day earlier.
Editorial Thoughts
Nearly $1B in a single day of inflows into spot BTC ETFs represents real money entering the market, so it would be wrong to reduce Bitcoin’s rally to a short squeeze. Liquidations accelerated the move, but they do not explain its strength on their own. The market now needs to show that this demand was not a one-off event.
For now, it is too early to call this the start of a new bull market. Bitcoin has quickly moved from $75,000 to $87,300, the market has built up leverage again, and the sentiment index has already entered the extreme greed zone. This is a strong recovery, but it still needs to prove that it has developed into a new cycle.
This post is for informational purposes only and does not constitute advertising or investment advice. Please do your own research before making any decisions.