Fear & Greed Index: How to Use It Instead of Just Staring at the Meter
CNNMoney built the original Fear and Greed Index for US equity markets in the spring of 2012. The index used seven inputs: momentum, stock price strength, stock price breadth, put-to-call option ratios, junk bond demand, market volatility, and safe-haven demand.
The crypto market got its very own index much later. Alternative.me adapted the principles of the original index and launched the Crypto Greed and Fear Index in February 2018. The new index reflected the sentiment of a market that moved faster, reacted more emotionally, and had far less institutional stabilisation than any mature equity exchange.
The crypto greed and fear index is still the most-watched sentiment metric in digital assets. This article answers ‘𝘞𝘩𝘢𝘵 𝘪𝘴 𝘵𝘩𝘦 𝘤𝘳𝘺𝘱𝘵𝘰 𝘧𝘦𝘢𝘳 𝘢𝘯𝘥 𝘨𝘳𝘦𝘦𝘥 𝘪𝘯𝘥𝘦𝘹?’ and '𝘏𝘰𝘸 𝘤𝘢𝘯 𝘺𝘰𝘶 𝘶𝘴𝘦 𝘪𝘵 𝘢𝘴 𝘢 𝘵𝘳𝘢𝘥𝘪𝘯𝘨 𝘴𝘪𝘨𝘯𝘢𝘭 𝘪𝘯 𝘵𝘢𝘯𝘥𝘦𝘮 𝘸𝘪𝘵𝘩 𝘰𝘵𝘩𝘦𝘳 𝘵𝘰𝘰𝘭𝘴?’
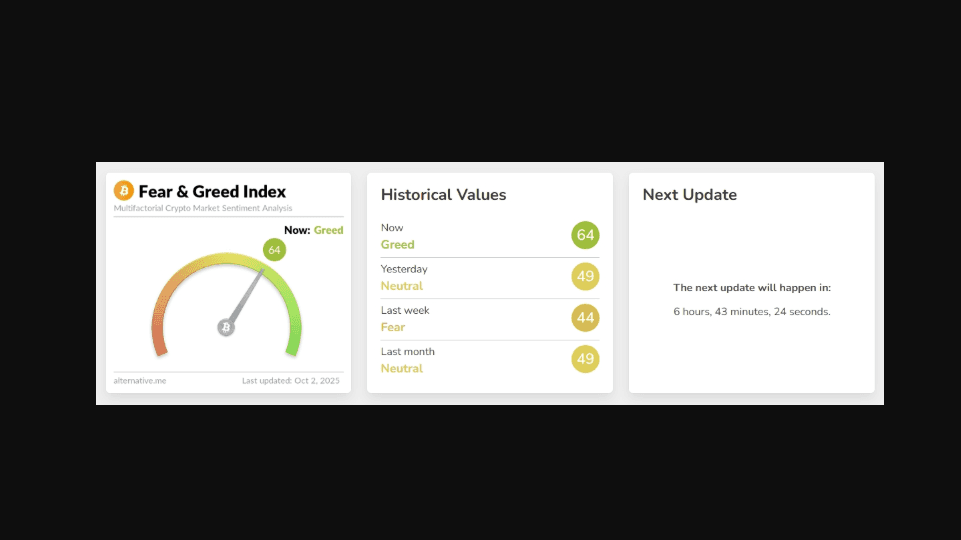
Source: Alternative.me | Crypto Fear and Greed Index
How is the Crypto Fear and Greed Index Calculated?
The crypto fear and greed index is calculated as the weighted average of five specific, quantifiable inputs. It updates every day at midnight UTC. It is denoted by a single number. 0 represents Extreme Fear, and 100 represents Extreme Greed. Most of the time, the index value sits somewhere in between, describing a market that is neither capitulating nor overheating.
Here’s the recipe for how the index uses the 5 inputs:
Volatility (25%)
The index compares current Bitcoin price volatility and maximum drawdown against 30-day and 90-day rolling averages. When BTC swings harder and further from its recent baseline, the index reads it as fear. If volatility is sustained and there is no directional recovery, the score remains suppressed despite intraday price volatility being lower.
Market Momentum and Volume (25%)
The index uses a comparison of current trading volume, price momentum, and their 30- and 90-day averages. Repeatedly high buy-side volume in a rising market signals greed, while declining volume into a falling price signals fear. This component points towards short-term price direction.
Social Aggregation (15%)
This component includes X (formerly Twitter) and Reddit post volume, and sentiment is analysed for engagement velocity around Bitcoin and major cryptocurrencies. How do you think the crypto fear and greed index gets calculated using on-chain and social data?
The social aggregation component is most prone to misreading during institutional distribution phases. That’s because institutional dealing happens via OTC desks. On-chain metrics can show heavy selling by large wallets, while the retail traders may remain bullish.
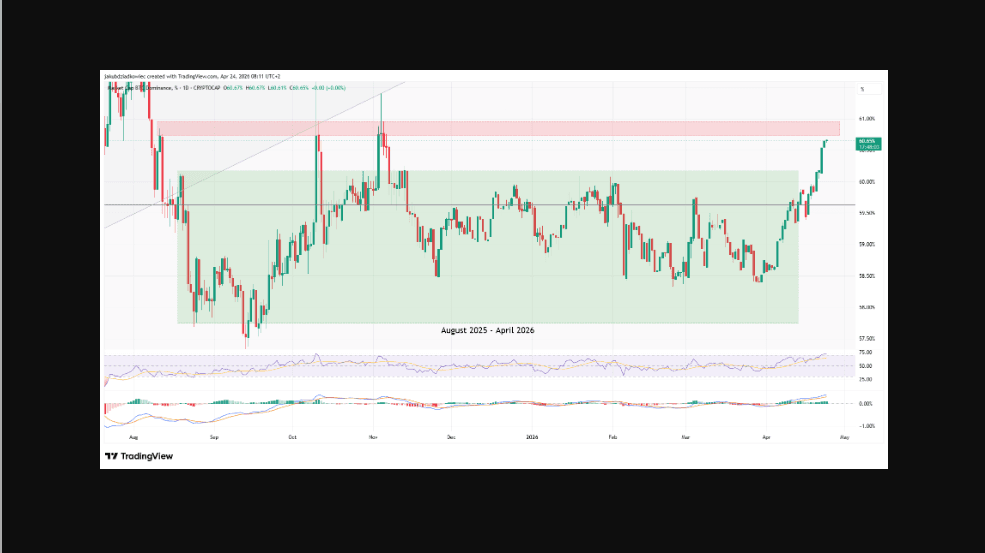
Bitcoin dominance measures Bitcoin’s total market capitalisation. Within the index, it tells how risk-averse or risk-seeking the traders are at any given time in the market. Rising BTC dominance is a sign of market fear, as capital rotates from speculative altcoins into Bitcoin. Falling dominance signals greed, as capital flows into higher-beta assets.
For instance, during the April 2026 drawdown, BTC dominance reached 60.66%, which directly pulled the index score down, independent of any price-level data.
Source: BeInCrypto | BTC Dominance between August 2025 and April 2026: The trader’s flight to safety during the drawdown
Search Velocity (10%)
The index uses search query volume data for crypto-related terms to determine where the market sentiment is shifting. Searches for ‘Bitcoin crash’ or ‘crypto going to zero’ lower the score. Whenever someone searches for terms like ‘buy Bitcoin’ or ‘Bitcoin price prediction’, the score increases.
Note: CNN weighted Search Velocity at 15%. Alternative.me paused using it as an input. It redistributed the 10% weight across the other remaining factors. The current live index tilts more heavily toward volatility and momentum data.
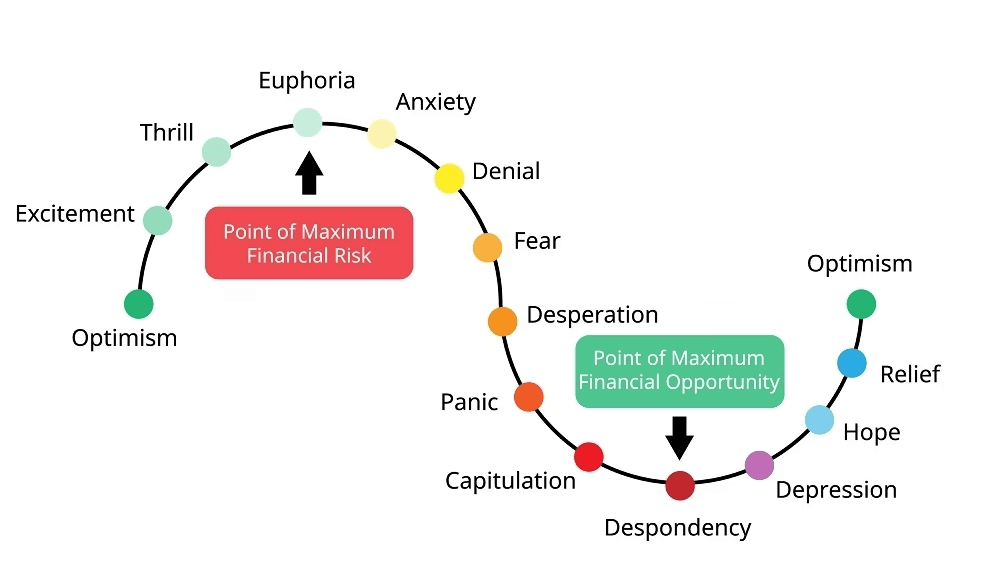
Source: BitDegree | The index indicates the cycle of market emotions, and isn’t a measure of how well the market is performing
As discussed, the index measures crowd psychology and market sentiment. It does not indicate or confirm the price structure, validate a support level, or account for macroeconomic conditions. Those inputs aren’t accounted for while calculating the index.
1. The Standalone Indicator Fallacy
Entering a position simply because the index hits a specific threshold is an invitation to liquidation because reading how the market is reacting isn’t sufficient to time a reversal. We will discuss how you can use the index and develop a rule-based framework to identify opportunities later in the article.
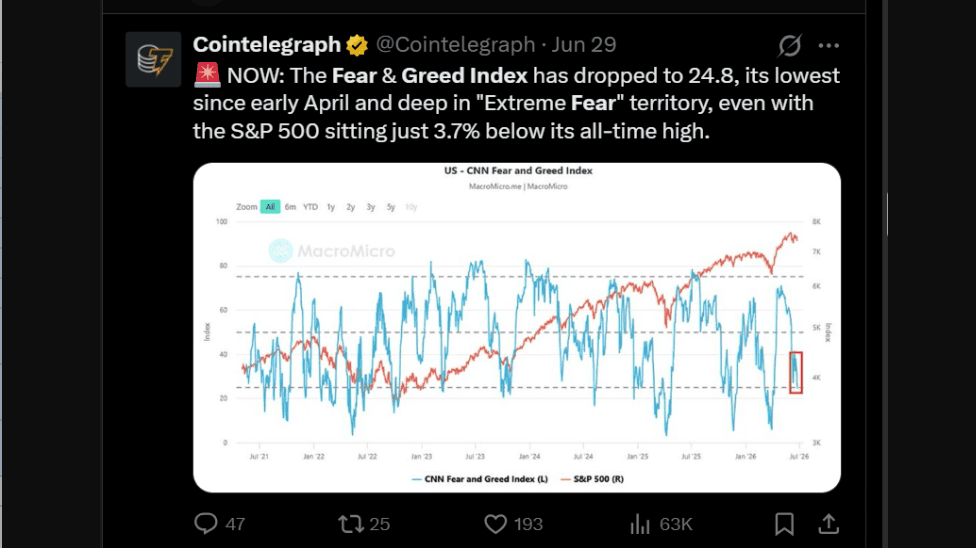
Check this tweet by Cointelegraph. CNN Fear and Greed Index here sits at a low of 24.8 in the Extreme Fear territory. But the S&P 500 at that time was sitting just 3.7% below its all-time high.
Source: X | Fear and Greed Index measures only the crowd sentiment
Similarly, during September 2022, the index sat at 21 in the Extreme Fear range. The Federal Reserve remained hawkish. And there was no structural support for market participants to bank on. Bitcoin fell further.
In March 2023, the index hit 20. The same reading, and this was at a time when the US’s regional banking turmoil was at its peak. Bitcoin still made it, rallying 12% in a week as the market bet on a policy pivot.
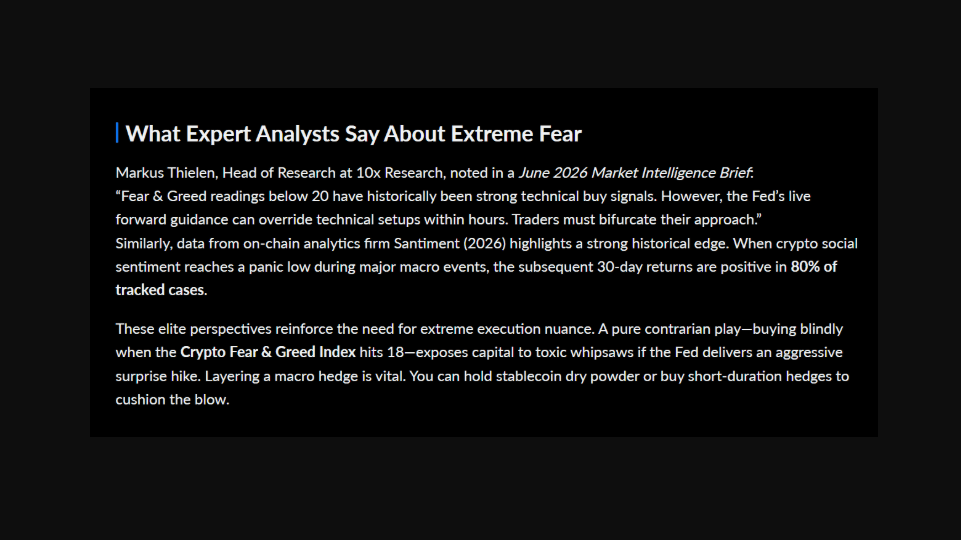
In both scenarios, the index number was nearly identical, but the context differed. That’s where the problem lies. Traders treat the index as a piece of evidence and buy blindly; they should exercise caution and pair it with other market and macroeconomic factors.
Source: BTCC Academy | Experts say traders must bifurcate their approach and not use the index blindly
2. Irrational Markets Outlast Leveraged Traders
Crowd psychology works on feedback loops. When liquidation happens in the retail market, it triggers further selling. More selling pressure, in turn, worsens the fear reading. A higher fear index number causes traders to sell further. Soon, a self-reinforcing action cycle starts, which can persist for months.
The 2022 bear market case study is a great example.
After Bitcoin broke below $38,000 on 5 May 2022, the index entered extreme fear and stayed below 25 for 72 consecutive days. This was the longest unbroken streak on record at the time.
During that period, prices fell by more than 40%, driven by rising interest rates and the sequential collapse of Luna and Celsius. However, Bitcoin took five months after the crypto index touched extreme fear to drop to $15,500 in November. Crypto experts called it a Keynesian problem. Markets can remain somber irrationally longer than a trader with a leveraged position.
Extreme fear is a necessary but not sufficient condition for a bottom. It requires structural confirmation before traders can use it as an edge.
Chronology of Extremes: What Past Tops and Bottoms Teach Us
Eight data points from 2019 to 2026 show how the same extreme reading produces opposite outcomes depending on the structural context it sits inside.
Date
Reading
Zone
Market Context
What Followed
Jun 2019
95 (ATH)
Extreme Greed
BTC peaked at ~$14,000; peak retail FOMO
Multi-month correction; BTC fell to ~$6,500 by Dec 2019
Mar 2020
8
Extreme Fear
COVID crash; BTC fell from $9K to under $4K in days
Full recovery above $10K within months; ATH by Dec 2020
Nov 9, 2021
84
Extreme Greed
One day before BTC all-time high: $69,044
BTC fell below $16K within a year; prolonged bear market
Jun 19, 2022
6 (ATL)
Extreme Fear
Luna/Celsius collapse; peak capitulation
BTC fell another ~50%; ultimate low ~$15.5K in Nov 2022
Dec 2024
88
Extreme Greed
BTC hit $109,000; institutional ETF demand strong
BTC continued to $124–126K; index cooled to 68–71 at those highs
No extreme reading at the top; index calibration is evolving
Mar 2026
12
Extreme Fear
BTC down 45% from ATH; tariff macro headwinds; 22 days below 25
Whale accumulation: +230,000 BTC since Dec 2025; outcome ongoing
Jun 2026
18
Extreme Fear
FOMC week; lowest FOMC-week reading on record
Outcome binary: Fed pivot = rally; hawkish hold = further downside
Observe how in 2021, the index reached 84 at Bitcoin's $69,044 ATH. The index was deep into Extreme Greed territory. Similarly, in October 2025, Bitcoin reached $126,080, but the index only printed 71.
There’s a structural shift behind the compressed reading in 2025. After the BTC ETFs launched in January 2024, institutional investors entered the market. These investors do not display the emotional volatility of retail participants. Subsequently, this maturation compresses the upper range of extreme readings.
A reading of 75 today may carry the same implied excess as 85 did in the previous cycle.
Combine Technical Indicators with Fear & Greed Index for a Rules-Based Operational Framework
Use the fear and greed index as one among the many tools. Use it in combination with fundamental analysis, research, Bitcoin rainbow charts, etc. Look for extremes. A reading change from 35 to 45 doesn’t trigger a buying/selling signal, but a change from 35 to 75 does.
You can use these three conditions as entry triggers when using the index alongside other tools to identify opportunities.
Condition A: Index at or below 15 for at least 5 consecutive days.
Don’t consider single-day readings. When multi-day readings sustain below 15, it indicates structural panic. Historically, also, when the index drops below 15, Bitcoin has posted positive 30-day returns approximately 80% of the time.
Buying during periods of fear has been more effective than buying during euphoria.
However, we cannot ignore the 20% of cases where the price continued to drop. Condition A, therefore, doesn’t suffice on its own.
Condition B: Price must be testing a higher-timeframe support zone
By a higher-timeframe support, we mean the 200-day EMA, a daily order block, or a historically validated long-term support level. The index reading might denote extreme fear, but the chart must confirm there is a structural reason for the price to hold.
If you can confirm extreme fear at a major support level, it is more probable that a sustained reversal in underway.
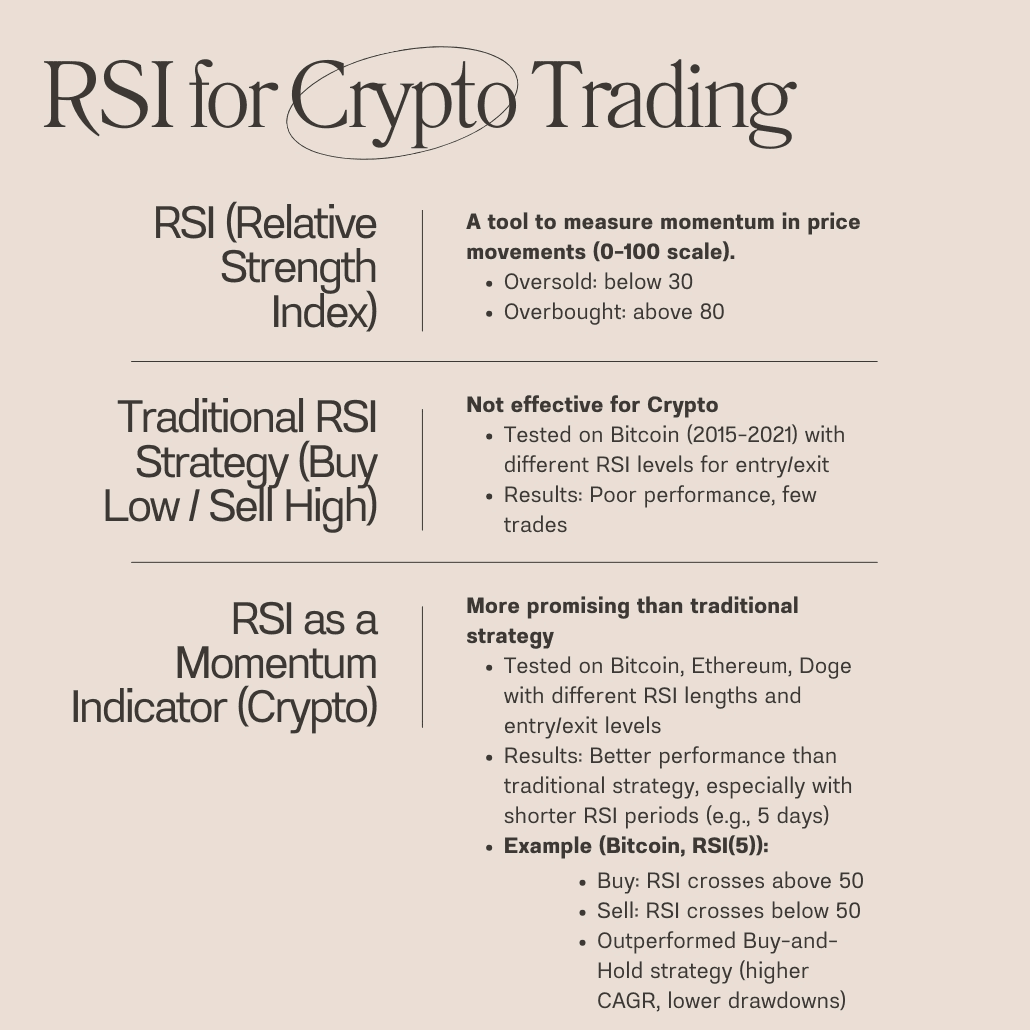
Condition C: RSI (14-Day) displaying bullish divergence on the daily timeframe, with supporting signals
Source: Quantified Strategies | RSI is a good momentum indicator in crypto trading
Divergence signals, such as the Relative Strength Index (RSI), are also useful. If RSI is forming higher lows while price forms lower lows, it is a bullish RSI divergence. During this phase, the selling momentum will decelerate even as the price continues to drift downward.
When combined with Conditions A and B, it completes a three-part filter with meaningful confirmation.
Dynamic Risk Control: DCA Scaling and Exit Mechanics
Entering During Multi-Week Capitulations
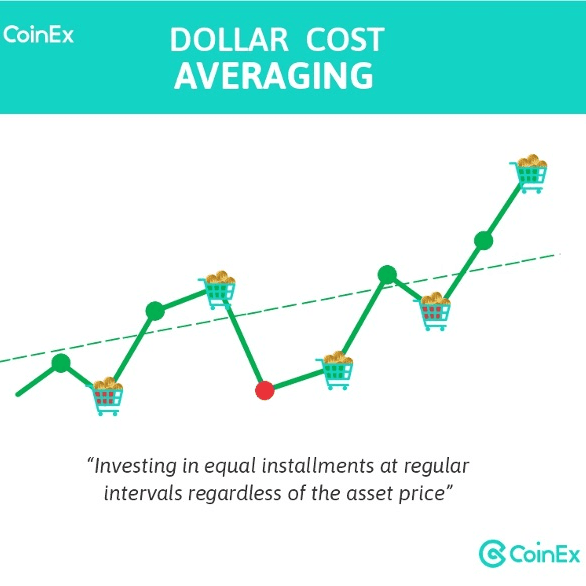
If the above three conditions are check-marked, you can follow a staged DCA model. Dollar-Cost averaging removes the impossible requirement to time the exact bottom and instead captures the average price across the fear period.
Source: CoinEx | Dollar-Cost averaging allows you to spread your investment without having to time the market
Tranche 1: Invest 20–25% of the intended allocation at first, confirmed A + B alignment
Tranche 2: Put in 25% at the next weekly close with Condition C confirmed (RSI divergence visible on the daily chart)
Tranche 3: Invest the next 25% if the index holds below 20 for another seven days, with no structural breakdown below the support zone
Tranche 4: Hold 25% as a reserve for a secondary dip below the original entry, or deploy only after the index crosses back above 25 with volume confirmation
Note: In DCA, "tranching" refers to breaking a large trading budget into smaller "slices" or portions.
A Spoted Crypto Research validates this strategy. It says how a seven-year contrarian DCA strategy concentrated during fear periods between 2018 and 2025 returned 1,145%. It outperformed a simple buy-and-hold strategy by 99 percentage points. Weekly DCA during fear periods sees 8–12% better volatility averaging than monthly lump-sum purchases.
Scaling Out as Greed Rises
The exit rule is the same as the entry logic, i.e., reduce exposure in tranches as the index climbs.
Index crosses 65 (Greed): Reduce position by 20–25% and tighten trailing stop to 5–7% below the current price
Index holds above 75 for more than one week: reduce by another 25%. Historical data shows corrections have followed within two to three weeks of sustained above-75 readings in every completed cycle
Index crosses 80 (Extreme Greed): Close the majority of the position. Hold only a small residual with a hard trailing stop
Let’s understand this with an historical example. The index reached 84 on 9 November 2021. Bitcoin hit $69,044 the following day and never returned to that level for three years. Similarly, the index reached 88 in December 2024 when Bitcoin hit $109,000.
In both cases, multi-week Extreme Greed preceded a meaningful top within days to weeks. The index did not specify the exact date, but it reduced the risk window to a level at which capital preservation decisions were clearly needed.
Index Zones vs Rules-Based Action
Score
Zone
What It Signals
Rules-Based Action
Key Caution
16–25
Fear
Bearish sentiment; below-average buy-side volume
Watch for Conditions B and C; no entry until duration threshold (5+ days) met
May deepen before reversing
26–46
Moderate Fear
Cautious market; accumulation by patient holders
Hold existing positions; no new contrarian entry
Not a contrarian signal zone
47–53
Neutral
Low-signal zone; mixed momentum and direction
Rely on technicals; index adds minimal edge here
Weakest predictive zone
54–75
Greed
Risk appetite rising; volume momentum building
Tighten trailing stops; scale out 20–25% if held above 65 for over a week
Scale out 50–75% of position; hard trailing stop on remainder
2021: reading 84 → BTC ATH next day
Treat Fear & Greed Index as One of The Many Indicators
The Fear and Greed Index is accurate about exactly what it measures, i.e., the average emotional temperature of the crowd at a given moment. Market mood is never the same as a trade signal. Unless the index agrees with other charts, momentum indicators and the macro factors, it’s a blunt knife trying to cut paper.
You need three confirmations pointing in the same direction, sustained for days, to make an allocation decision worth making. You get to know when the crowd is behaving irrationally from the index. But when it will stop is an altogether different set of calculations.