The New Bitcoin Cycle Without the Old Four-Year Halving Pattern
Why classic four-year halving patterns are breaking down as spot ETFs, corporate balance sheets, and global macro liquidity reshape Bitcoin's price action.
The New Bitcoin Cycle Without the Old Four-Year Halving Pattern
At the Bitcoin for Corporations conference in Las Vegas in February 2026, Michael Saylor argued that retail demand and the halving-led supply shocks no longer impact Bitcoin’s price movements, and that institutions have taken over ever since Bitcoin ETFs got launched in 2024.
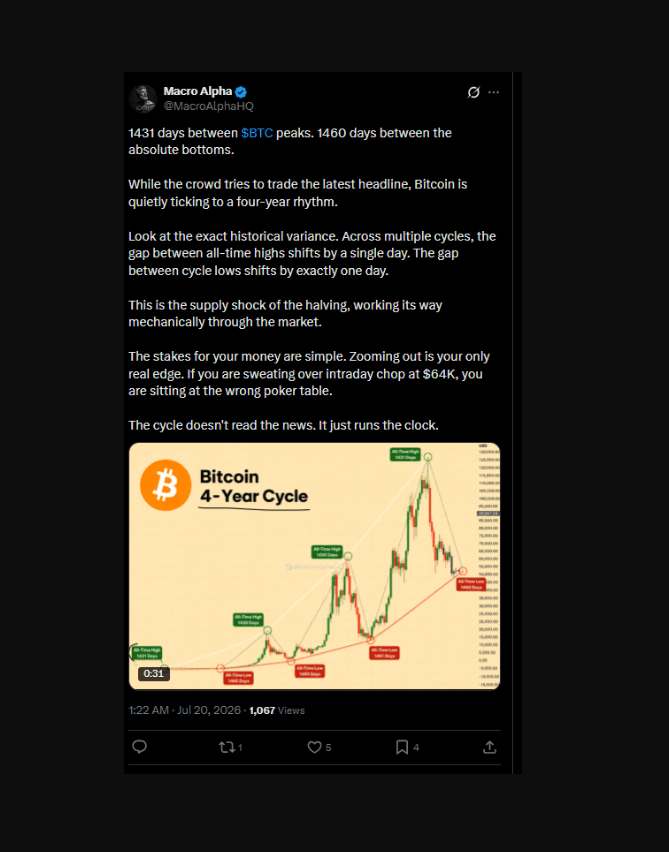
But Crypto Twitter is divided into two camps. On one side, the ‘halving-impacts- Bitcoin-prices’ camp vehemently supports the idea. According to them, halving gives a familiar rhythm to Bitcoin’s price movements.
Crypto Twitter is divided into two camps on the relevance of Bitcoin halving
Every four years, halving triggers a bull run followed by a sharp correction. After which, the post-halving recovery kicks in. This cycle repeats like clockwork with every halving event.
But the other faction debates otherwise. According to them, halving has only psychological relevance for traders today, as the incoming Bitcoin supply is minuscule compared to the billions of dollars in institutional flows and ETF markets.
In this article we’ll cover the Bitcoin halving cycle’s current status in 2026, its mechanics, and receding relevance, and which other fresh factors have started to impact Bitcoin’s price more.
Broken Halving Mechanics: Why Bitcoin’s Supply Mathematics Matters Less Each Time
Bitcoin Halving Cycle Explained
Bitcoin supply mathematics is pretty straightforward.
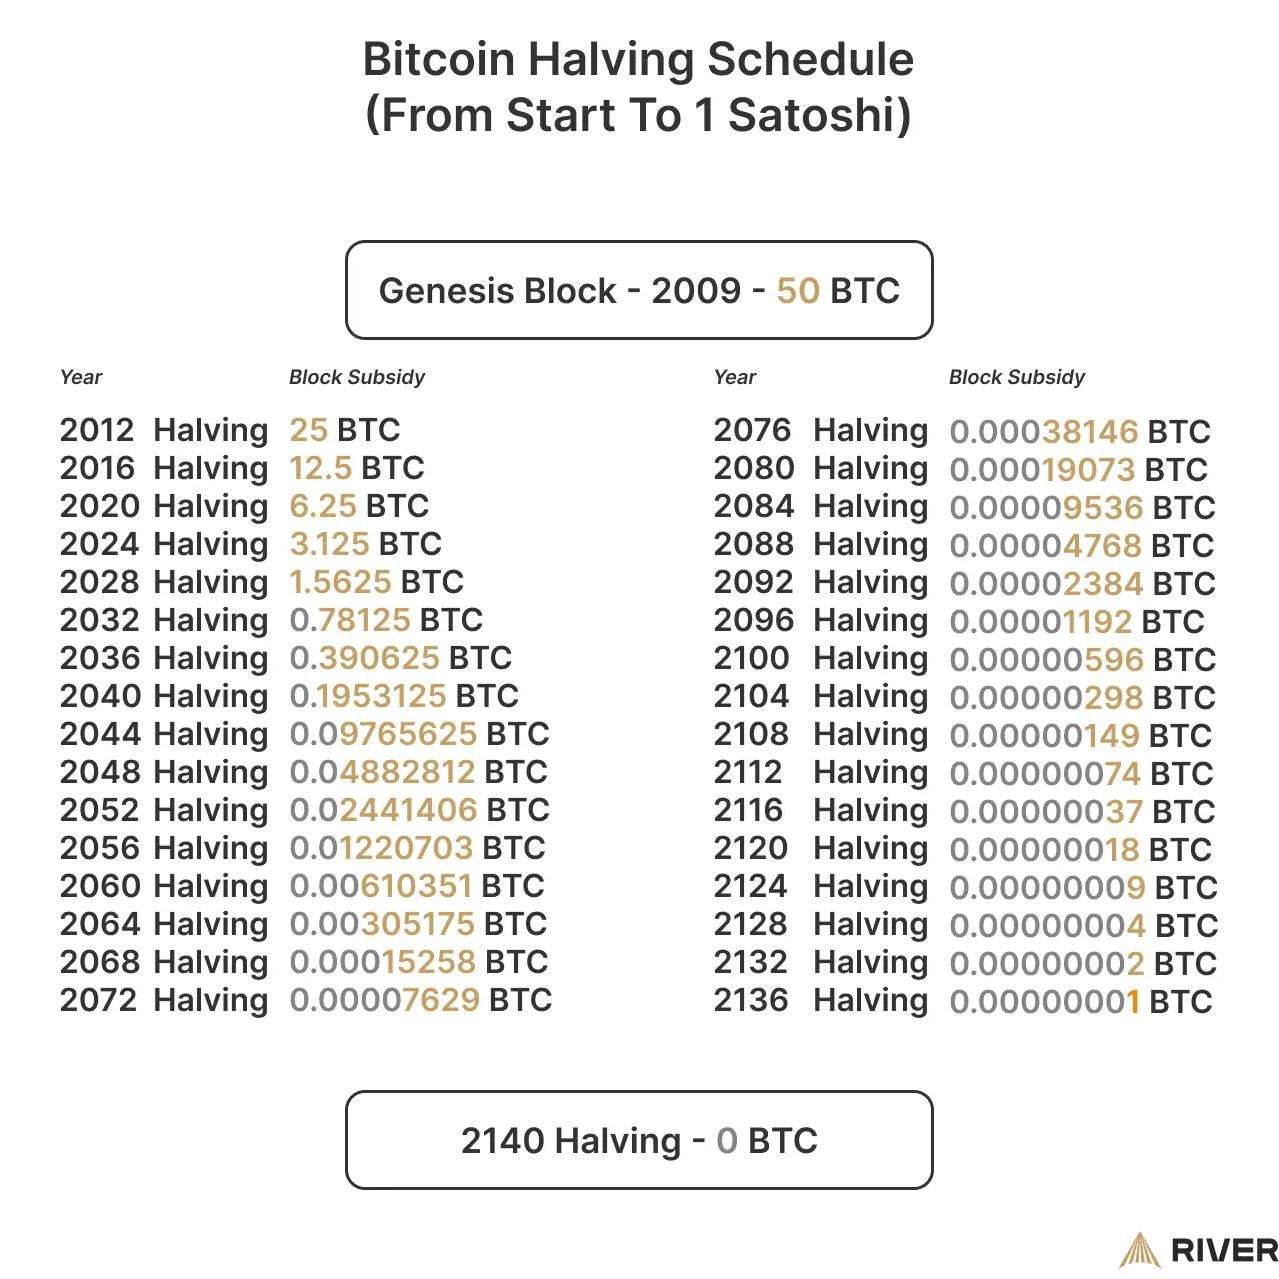
Every 210,000 blocks, the mining rewards paid to miners are halved. The event is called halving, and it happens every four years. April 2024 saw the 4th halving, with rewards falling from 6.125 to 3.125 BTC per block.
Source: River | Bitcoin halving schedule
The halving cycle allows inbuilt scarcity, and these events act as organic supply shocks. For instance, miners were receiving approximately $29 million worth of new Bitcoin per day across the entire network after the April 2024 halving.
As a standalone number, that may seem significant. But in a market with $100 billion in trading volume, that number holds little value.
Bitcoin has witnessed a flattening curve as far as its halving returns are concerned. Look at the table below:
Halving
Block Reward
Peak Return (from halving)
60-day Volatility at Halving
Subsequent Bear Drawdown
Nov 2012
25 BTC
~9,200% (92×)
>200%
85%
Jul 2016
12.5 BTC
~2,900% (30×)
~70%
83%
May 2020
6.25 BTC
~690% (7.9×)
~60%
77%
Apr 2024
3.125 BTC
~100% (1.9×) to Oct 2025 ATH
~50% (lowest on record)
~51% so far (shallowest on record)
The halving used to move markets because the new supply mattered. Now the limited number of Bitcoins entering the supply barely register against what long-term holders decide to do. If you see the peak return column in the table, you would notice how the returns are roughly getting divided by 3 with every subsequent halving event.
Supply Mathematics: The Catch-22 of Halving
Halving governs Bitcoin’s supply mechanics and, in turn, its price movements. But over the years, Bitcoin has seen a flattening post-halving performance for obvious reasons.
Lyn Alden, an American investment strategist and founder of Lyn Alden Investment Strategy, explains the inherent flaw in the halving cycle. Earlier, each newly mined Bitcoin block had more coins coming out as rewards. For instance, in 2012, the halving cut daily miner output by 3,600 BTC in a market so small that the reduction was seismic.
94% of Bitcoin’s total supply has already been mined. Annual inflation fell from 1.7% before the 2024 halving to 0.85% after it. The market had been pricing in this move for months before the block reward actually changed.
Bitcoin now has an annual supply growth of less than 1%. When you have 0.8% annual supply growth, and you have a halving, you cut that to 0.4%. That's less relevant than whether 5% of long-term held coins are coming to market because owners want to cash out.
Saylor says Bitcoin behaves more like a digital asset today. It declined as the equities fell during the 2022 rate-hike cycle, and rallied as global liquidity improved in the next 3 years.
Bitcoin increasingly trades like a macro asset sensitive to real yields, liquidity flows, and risk appetite.
Post-Halving Return Multiples: The Flattening Curve
Simple supply shocks forced by halving don’t impact it the way they used to. ETFs and institutional buyers are soaking up more Bitcoin supply than is mined each day. Retail speculates, but it is the macro forces that determine Bitcoin’s price movements today.
What we must understand here is that Bitcoin’s diminishing returns don’t signal market failure. Today Bitcoin is a $1.3 trillion asset, and it cannot compound like a $100 million asset can. The lesser returns are a result of the market maturing.
Every completed Bitcoin bear market has been shallower than the one before it. The current halving status shows a maximum drawdown of 51.2% from the $126,198 October 2025 ATH. This has to be the shallowest bear market on record, compared to a historical average of 79.4%.
Year
Drawdown
2011
93%
2013-15
87%
2017-18
84%
2021-2022
77%
2025-2026
51.2%
The shallower drawdowns reflect a structural change in the market, and as to who holds the asset and controls its prices. Corporate treasuries accumulate on the way down. ETF holders have quarterly rebalancing mandates. The institutional base absorbs sell pressure that would have driven 80%+ drawdowns in prior retail-dominated cycles.
What This Means for Dollar-Cost Averaging
Lower volatility and shallower drawdowns change the DCA calculus in two directions.
On one hand, the extreme fear discounts of prior cycles may not repeat at the same depth now. For example, the 80%-off accumulation windows that made dollar-cost averaging in 2018 or 2022 so compelling in hindsight would no longer hold today.
On the other hand, shallower bear markets tend to resolve faster. For example, the 2021 cycle recovered to ATH in approximately 480 days versus the 2017 cycle's 730 days.
The risk for 2026 DCA buyers is different from prior cycles. You need not fear a capitulation crash to 80% below ATH. Emotional drawdowns are a pass. Look for prolonged sideways-to-down environments where the Fed QT pipeline suppresses macro risk appetite for longer.
ETFs, Corporates, and Macro Liquidity Are The New Market Drivers
A. Spot ETFs
Spot ETFs eclipsed the halving supply shock in 2024. The daily miner output holds no chance against the combined daily ETF flows. For instance, after the April 2024 halving, miners produce approximately 450 BTC per day. BlackRock's IBIT, on a strong inflow day, can absorb the entire day's new miner supply in minutes.
Bitcoin ETF statistics at a glance:
Bitcoin Spot ETF Performance
Cumulative net inflows (since January 2024)
$50.85 billion (as of July 2026)
Total US spot Bitcoin ETF AUM
$76 billion (mid-2026)
BlackRock IBIT net assets (end of 2025)
$67.4 billion (SEC 10-K filing)
Bitcoin locked in global ETFs
1.3 million BTC (approximately 7.2% of total supply)
Public companies now hold over 7.8% of the total Bitcoin supply on their balance sheets. Strategy (formerly MicroStrategy) alone holds 843,775 BTC as of July 2026. That’s 4% of the total supply, accumulated at an average cost basis of approximately $75,651 per coin.
Corporate treasuries do not panic-sell during a drawdown like retailers. Strategy has continued accumulating through every correction since 2020. It finances purchases through equity raises and convertible notes regardless of short-term price action.
Seventy or more public companies worldwide now replicate some version of this model. That creates a demand floor with no analogue in any prior cycle.
C. Macro Liquidity
The Bitcoin market analysis of the 2026 halving cycle cannot be understood without examining macro liquidity. Bitcoin's 6-month correlation with the Nasdaq reached 92% by September 2025. Whereas its correlation with the S&P 500 stood at approximately 0.74 in March 2026.
These correlation coefficients do not reflect the performance of a supply-shock-driven asset. Bitcoin now behaves as a digital asset, a rather leveraged proxy of a macro asset.
The April 2024 halving arrived mid-cycle in a macro environment of elevated real interest rates and Federal Reserve quantitative tightening. Macroeconomic conditions determined the trajectory that followed.
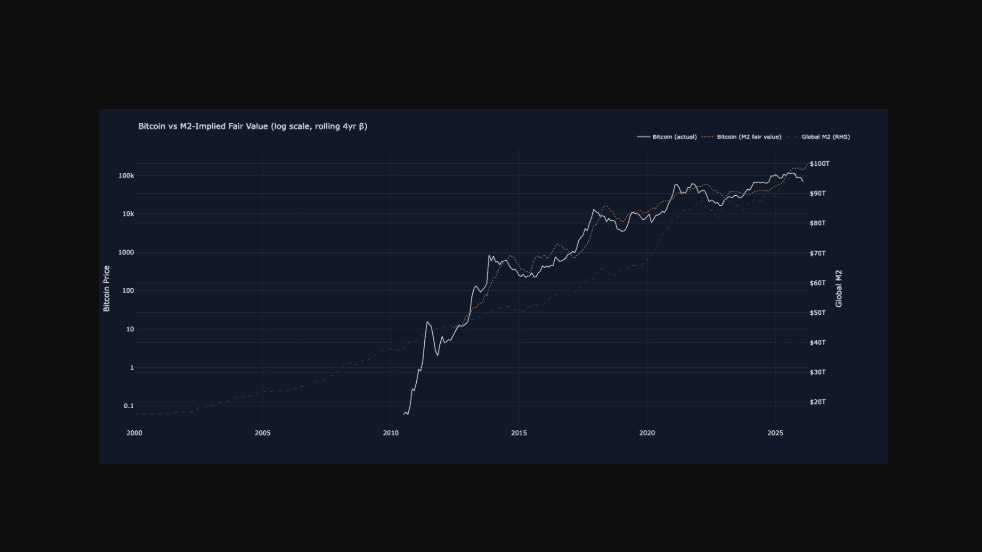
For instance, CF Benchmarks' M2-implied fair value model placed Bitcoin's fair value at approximately $136,000 as of February 2026, against an actual price near $74,000. This was one of the widest gaps in the model's history, attributable primarily to Fed QT compressing liquidity.
Checklist: What to Watch Instead of the Halving Date
Track BlackRock's IBIT and the other major spot ETFs. On strong inflow days, ETFs alone can absorb the entire day's mined supply in minutes.
Watch the percentage of long-held coins moving to exchanges. Long-term holder (LTH) selling behaviour is more influential on price than the halving's supply cut.
Monitor disclosed buys from Strategy and the 70+ public companies running similar treasury models. Rising accumulation signals a firming demand floor.
Keep a tab on Fed policy meetings, real yield trends, and quantitative tightening/easing decisions, which now move Bitcoin more directly than block rewards.
CF Benchmarks' M2-implied fair value model is a useful metric for how far price has diverged from liquidity conditions.
Compare the current drawdown against the historical average to gauge whether institutional absorption is holding.
The Behavioural Trap: Anchoring to Charts That No Longer Apply
Two specific models circulate endlessly on crypto social media every time Bitcoin enters a correction. Stock-to-Flow (S2F) predicted Bitcoin would sustain prices above $100,000 through the 2021 cycle. But it did not. Similarly, Calendar anchoring, i.e., the "18 months post-halving" peak expectation, is derived from three data points across two decades.
Both these parameters were built on retail-dominated market data and have not been updated to reflect the institutional regime that replaced it. Also, remember that relying on legacy chart-pattern expectations can produce false signals in a market whose participant base has fundamentally changed.
The 2026 investor playbook isn’t centred around DCA strategies waiting for an 80% capitulation. The market retired them long ago. The floor is being set by ETF rebalancing schedules, corporate treasury buying, and Fed liquidity.
That nowhere means DCA has become obsolete. Rather, investors should stop just relying on the halving clock and revolving their DCA lineup around that. The market is maturing, and Bitcoin is travelling ‘the road not taken’ as of yet by any known asset.
Keep a watch on ETF flows, LTH selling, and macro liquidity instead to read the cycle more accurately, whether or not it still runs on a four-year rhythm.